
Information Theory: The Hick Hyman Law & Fitts’ Law
The Hick-Hyman Law and Fitts’ Law are two principles with foundations rooted in the concept of Information Theory. First published in 1949 by Shannon and Weaver, Information Theory was initially developed as a way to explain how people process information and the idea of people as information processors. The classical understanding of information theory revolves around the concept of an information source that produces a message, which is then transmitted through a channel. The transmitted message reaches the receiver that reconstructs the message to the destination. In this theory, information is defined as the reduction in uncertainty and is quantified by bits (Seow, 2005).
The Hick-Hyman Law presents an understanding of choice reaction time in relation to the number of alternate stimuli. In regards to Information Theory, the Hick-Hyman law is specifically concerned with the time it takes for an individual to process a message and reconstruct that message to the correct destination (decision process). According to the law, an individual presented with more information will have a longer decision-making process than an individual presented with less information. Over multiple trials an understanding of a persons process limits can be acquired. The Hick-Hyman Law is useful when designing interfaces for human interaction. Determining the optimal amount of presented information can ultimately have a large effect on processing time and difficulty. Furthermore, depending on the application, these variances in processing time can potentially have a large impact.
Fitts’ Law states that there exists a linear relationship between task difficulty and movement time (response time). Task difficulty is determined by calculating the index of difficulty, which is specified by the distance (amplitude) between targets and the width of the target. Using this law as a guideline for interface design, developers can modify task completion time to either decrease task time or purposefully increase the time it takes to select a target, thereby controlling an individuals’ interaction with an interface and overall experience.
In a study of the Hick-Hyman Law and Fitts’ Law, participants conducted a card sort task. There were a total of 7 distinct sort tasks, each having two distinct interfaces (A and B), yielding a total of 14 trials for each participant. For each sort task the participant was instructed to indicate the correct decision by interacting with the interface. After making a decision a new stimulus was presented. Decision times and response choice were recorded.
Hick-Hyman Law
Following extensive data analysis, a graphical representation was developed to show the relationship between group average response times and calculated transmitted information values for each trial (figure 1). The graph also indicates the line of best fit, including the line equation and R2 value. From this representation we can analyze the results of our study. It is quite obvious that there does in fact exist a positive correlation between response time and transmitted information. With an R2 value of 0.3476, 34.76% of variation in ‘y’ can be explained by the changes in ‘x’. While this isn’t a perfect value (R2 =1) it is reasonable for real world data. There are a number of external factors that could potentially have an effect on response time beyond the amount of transmitted information. Looking at the distribution of average scores, it is important to note that actual transmitted information values for each trial generally correspond to their expected bit value. The slope of the line is a representation of the groups’ average internal processing speed. Building on this analysis of the best-fit line equation, we can determine the expected minimal possible response time to be 0.8858 seconds, which is found when transmitted information is equal to zero. The line of best fit helps to interpret the study data by visually indicating what trials are better representations of the Hick-Hyman Law, in addition to indicating those trials that do not fit the model.


Since this study was conducted in a real world setting there are a number of influences on transmitted information and response times. The level to which a person is familiar with a deck of cards, the test environment, computer hardware and software limitations are all things to consider when analyzing the data results. Specifically analyzing a divergent set of Ht (calculated for errors) values from their expected Hs (no errors) values in trials 3a and 3b we note that though the trials were technically 1 bit (two response options), participants took a longer time than expected to choose their response. This is likely because of the response choices. For this set, the participant needed to either choose “Red Face/ Black Non-Face” or “Black Face/ Red Non-Face.” Embedded in these response options are multiple levels of processing. The participant must first determine color then card value and choose the correct target button. The complexity of this one set highlights a potential explanation for the variance of response values when compared to their expected values.
Another set that differs from expectation is 7a and 7b. For other trials, the A and B versions are fairly similar however for this one there is a clear indication that the A version was easier for participants to complete. This is likely due to the target interface having a large impact on the ability to respond to the information quickly. Though horizontally aligned, there is a large discrepancy between the vertical placement of the 7a and 7b values. The Hick-Hyman law is limited by its definition and design in that it does not account for interface variances. Data representation, though when ‘logical’, is not always truly logical for a user. Counterintuitive labeling and interface design definitely has an influence on the results for the Hick-Hyman study.
Comparing the group aggregate data to the personal data set reveals that the group data fits the Hick-Hyman model better than the personal data by looking at the R2 values. Furthermore, comparing slopes of the lines of best fit reveals that the personal data was achieved with a slightly slower internal processing speed. However, the minimum possible response time is calculated to be slightly lower than the group average. Comparing individual response data can help build a more comprehensive understanding of one’s performance in an equivalent task. As seen by the analysis of the personal and group aggregate data, it is understandable that the group data is a more accurate representation of the Hick Hyman law seeing that it is the result of many more test trials.
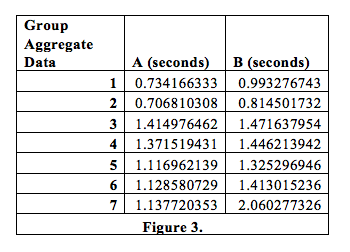
For every group aggregate trial, the A version had faster response times than the B version, indicating that participants were able to process the transmitted information faster (Figure 3). Though marginal, the difference in response times indicates that the version A was generally easier to interpret and is a result of interface variance between the two versions.
Fitts’ Law
After calculating the Index of Difficulty based off of the distance between targets and target width for each set, the data was graphed in relation to average motion times (response times). The results indicate that participants had faster response times for less difficult interfaces. Similarly, participants performed slower with the higher scoring Index of Difficulty sets. From the results we can also see that the B trials overall were more difficult than their corresponding A versions. Fitts’ Law is fairly good at approximating the data. With an R2 of 0.43685, the model fits the data better than the previous Hick-Hyman analysis (Figure 4). Fitts’ Law also provides an understanding for the implications of physical interface design where the Hick-Hyman law could not. A comparison of the group average data to personal data reveals that the personal data is more representative of Fitts’ Law (Personal data R2 = 0.563). Though technically more representative, the difference is less than 10% (Figure 5). Applying this law to interface design can ensure an interface that performs to very specific constraints.


References
Seow, S. C. (2005). Information Theoretic models of HCI: A comparison of the hick-hyman law and fitts’ law. Human Computer Interaction. 20.